
Industry
Public Sector
Highlight
86% ease-of-use rating
Munich Weekly Market Map: From Complex Data to Intuitive Discovery


Impact
Turning complex weekly market open data into simple user experience with 86% ease-of-use rating.
Time
2 Weeks
Tool
Business Context & Goal
Transform Munich’s open weekly-market data into an accessible interface that helps residents and newcomers quickly find market locations and opening hours.
Business Problem
Declining market visits reduced vendor sales, limited access to fresh food, and eroded trust between vendors and the city.
Constraints
Personnel: No dedicated in-house UX designer.
Technology: City website and market dataset are not connected.
Research: Limited outreach; research relies on proxies from Berlin and other German cities.
Solution
A local market map app designed to simplify user navigation for the market's live operating time and products, and the transportation guide.
My Role
UX/UI Designer
Conducted 5 user interviews and 5 usability testing interviews to identify user pain points and design improvements
Designed high-fidelity prototype of the märkte München mobile app as design solution
Iterated map design after usability testing
Research
User Research Assumptions
Channel: Users rely on Google Maps, search engines, and official city pages—not raw open data.
Device: Target audience prioritizes mobile devices over desktop when searching on the go.
Solution: A mobile-optimized website standardizing market data directly drives foot traffic to vendors.
User Research Method & Insights
I used generative user research method and conducted remote user interviews with 5 proxy users. With the assistance of NotebookLM, I generated the user research report and insights.
Core Problems
Unpredictable market operation time
Long commuting distances
Early vendor closures and lack of transparent inventory
Crowds
Define and Ideate
Define: Archetype, JTBD and Problem Statement
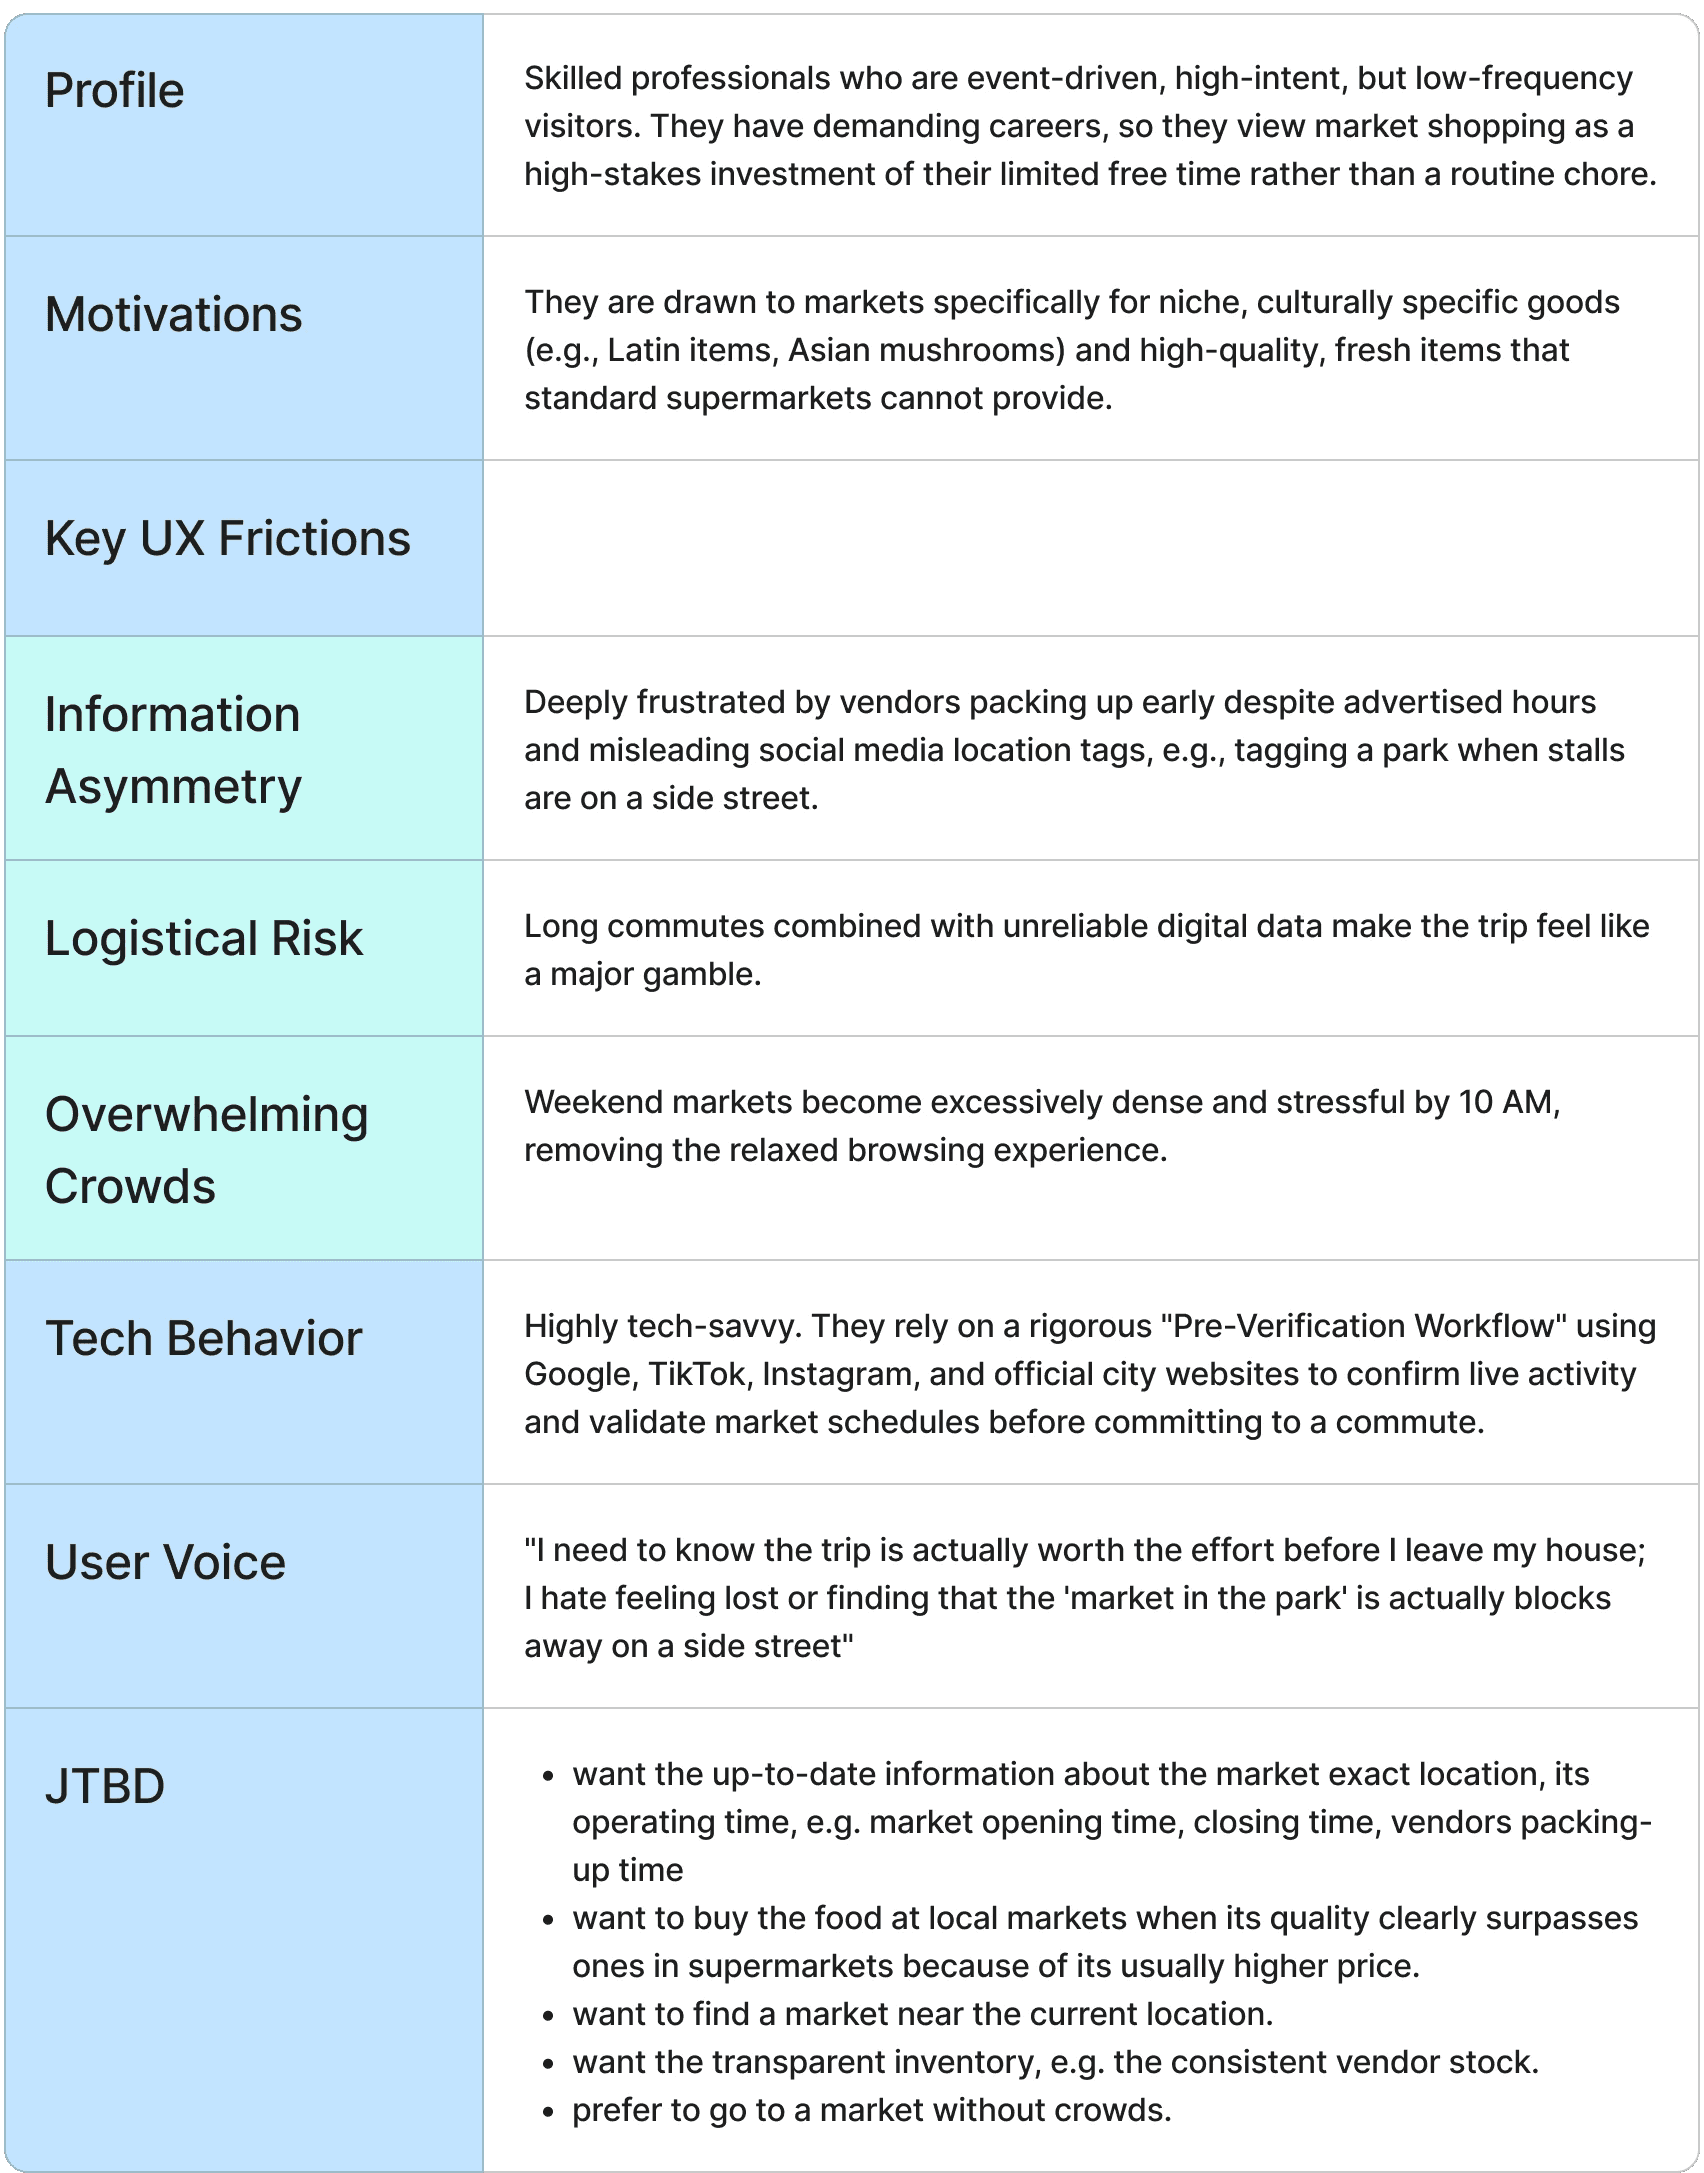
Archetype: The Opportunistic Shopper
Problem Statement
The residents and newcomers living in Munich seldom go to the weekly markets when they are unable to find the up-to-date information about the market location, its operating time, and the transparent inventory to buy fresh food conveniently. This is a problem because:
It can decrease market vendors profits due to low visits.
The increasing distrust of local market vendors in the city of Munich.
How Might We?
How might we make the information about the weekly market location and its operating time in Munich up-to-date and useful for the residents and newcomers to buy fresh food conveniently so that more people want to visit the marekts?
Ideate
Customer Journey Map
The customer journey map presented how the user pain points create opportunities for simplifying customers experience looking for the needed information on operation times, transportation, market product list.

Competitor Analysis
Based on competitor analysis, Google Map meets most of user needs. Therefore, I decided to integrate Google Map's features into the Munich weekly market map design including quick navigation and updated market operation and inventory information to help customer's onboarding experience faster and more easily.

User Flow
The user flow maps how a researcher living in Munich finds a local market nearby and the relevant information by using the design solution with simple and quick steps.

Design
Design Hypothesis
Hypothesis
Design the interactive mobile market map that users can find the needed information on the Märkte München Website quickly will enhance usability and user-friendly experience.
Design Changes
Design the mobile interface of the map with the search bar and locate me feature for searching markets nearby
Add the information modal including the name of the market, its overview, its location, the up-to-date operating time, the peak time paradigm, an update notification bell button, a route button, and a vendors button.
Metrics
80% positive usability ratings with the mobile Munich weekly market map.
Wireframing

High-Fidelity Protoype 1st Version

Testing
Usability Testing
I tested the Märkte München map prototype with 5 proxy users from German cities through moderated online sessions. Participants completed a realistic task to find a nearby open market and check its key information, using think-aloud. The 13 questions focused on map search, visual feedback, information hierarchy, navigation, and overall usability.
Result
Based on the feedback from the testing report, here is key findings of the testing result analysis:
0 user is able to distinguishe open vs. closed market pins without clicking them.
80% users find current position or searches on first try and locate route directions button under 3 seconds.
86% users rate the prototype easy and very easy to use.
100% users tap pin and open detail modal successfully on first try and understand busiest hours graph instantly.
60% Users suggest to add rating or customer review for the market and individual vendors.
Iteration
Design Change & Improvements Based On Testing Feedback
Refined Pin UI: Integrated color-coded open/closed states and live distance directly into pins.
Added Route Guidance: Introduced a transportation modal with multi-modal options upon clicking "Directions."
Simplified Info Flow: Streamlined map pin interaction from a 2-tap modal expansion to a single tap.
High-Fidelity Protoype Iteration

Before
Weekly Markets Munich Open Dataset
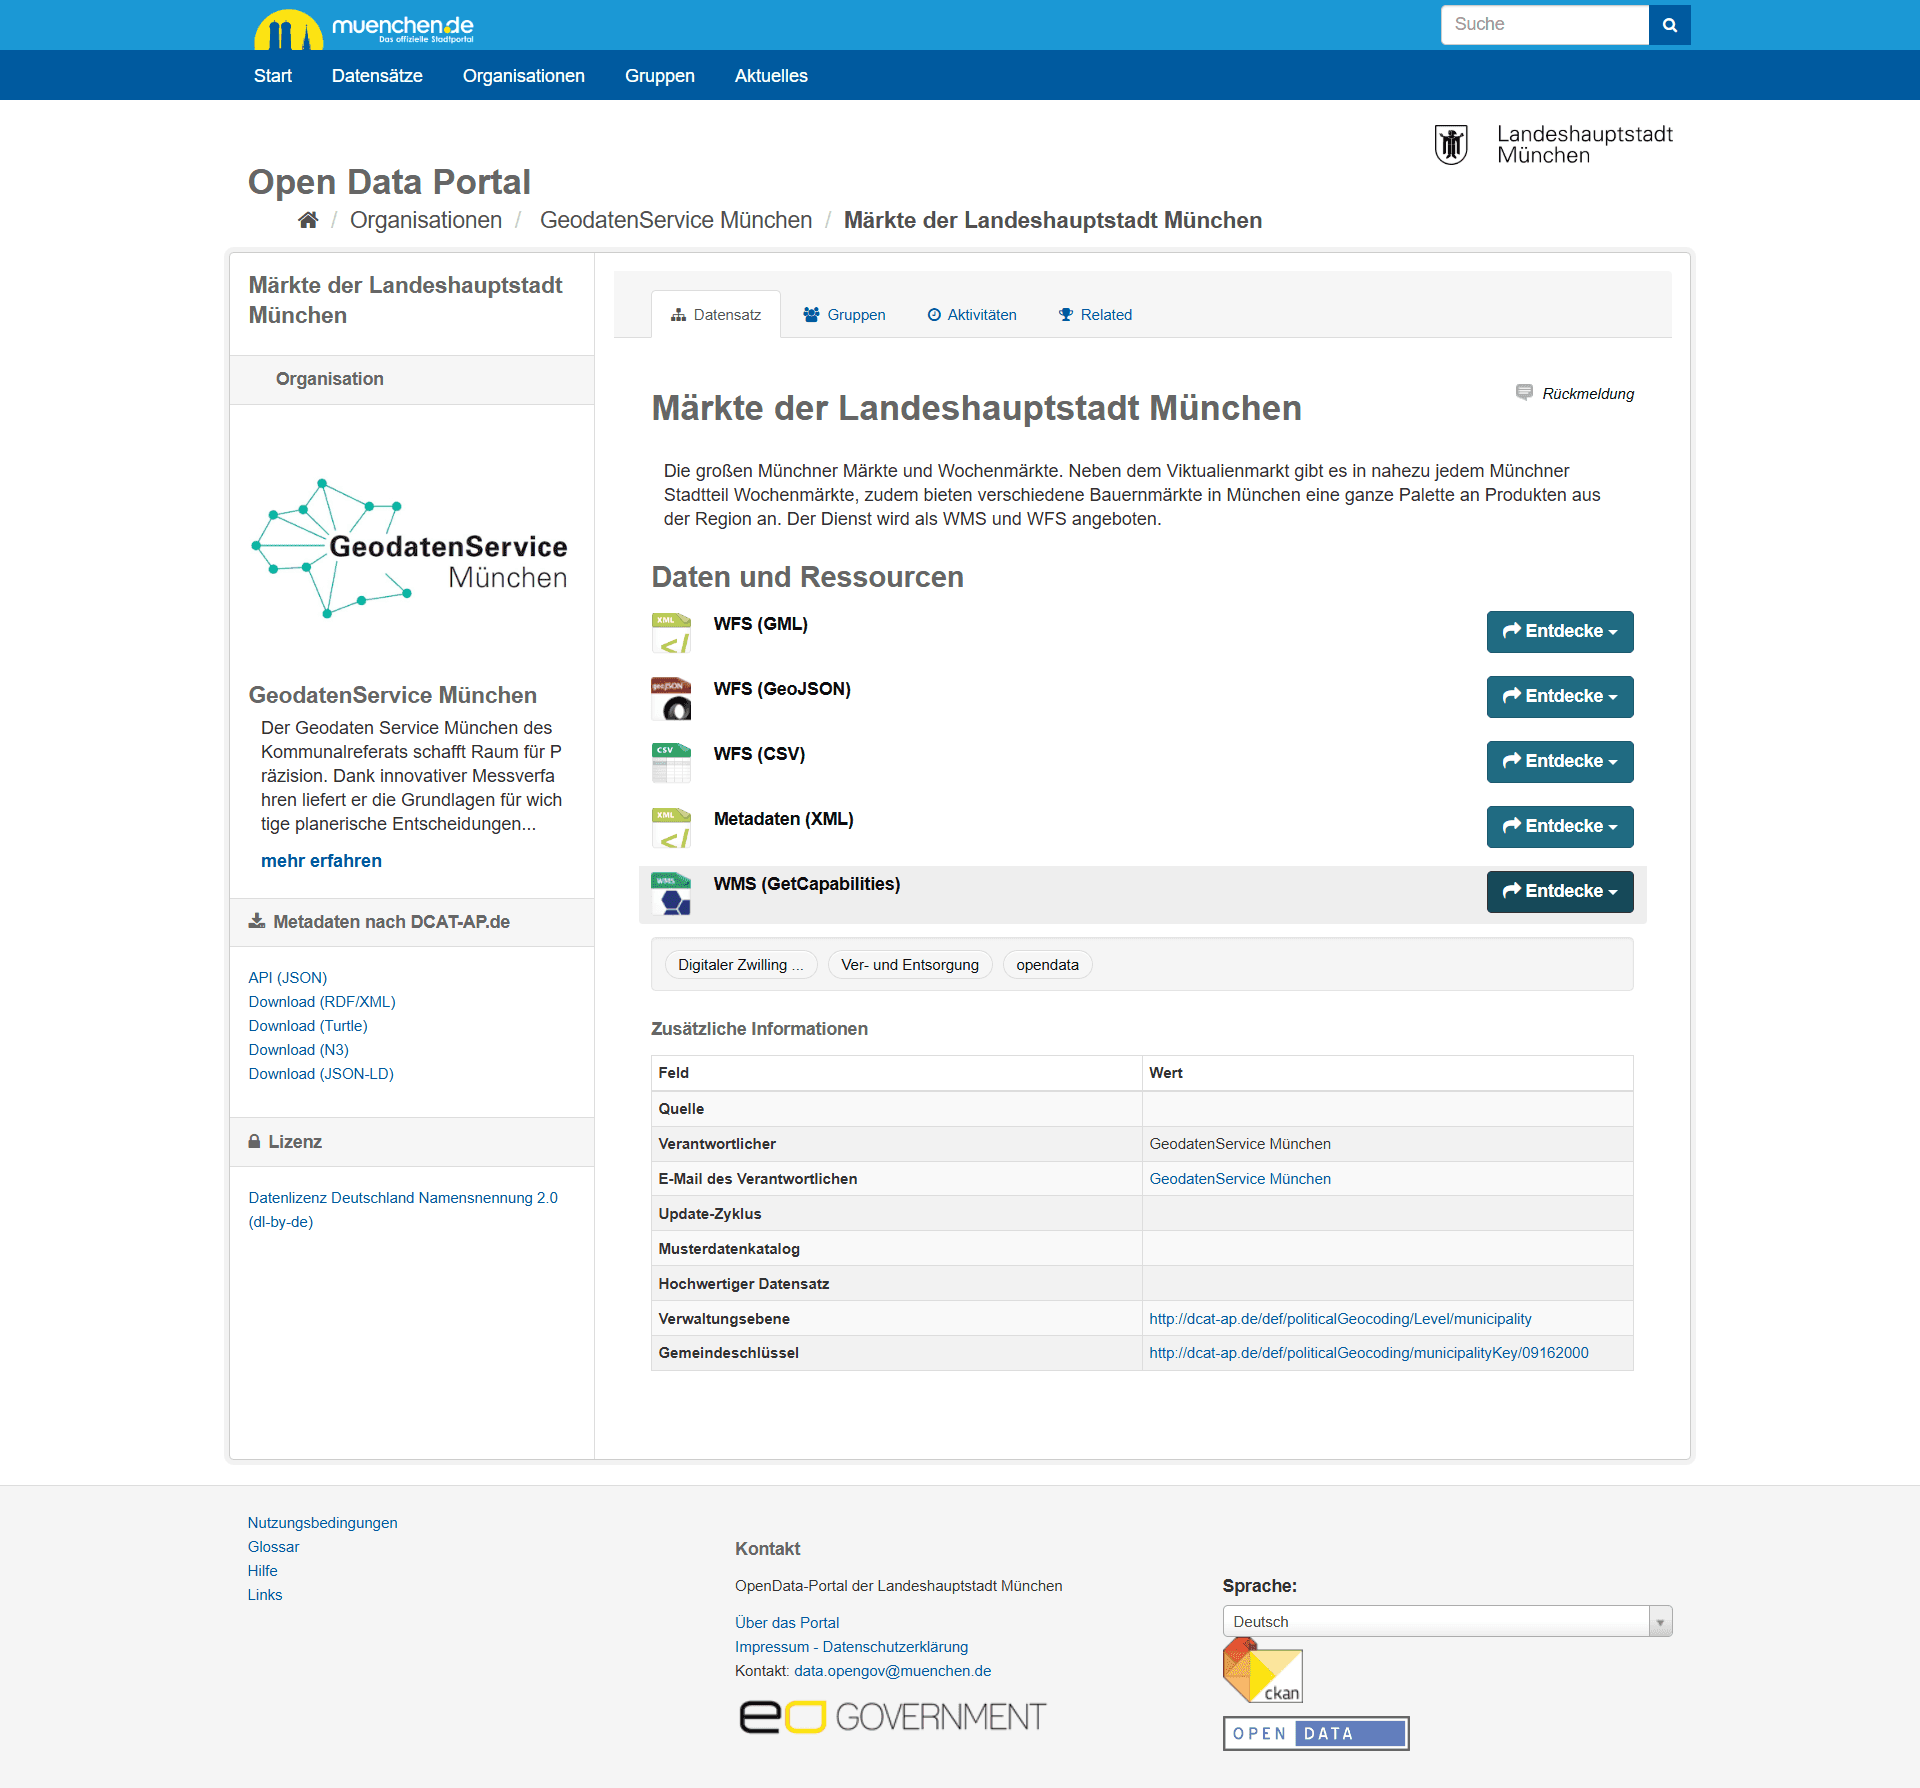
Weekly Markets Munich Website

After
Lessons Learned
Progressive Info Disclosure: Users expect operating hours upfront on hover; deep-dive details (routes, distance, transit modes) are only needed once they confirm the market is open.
Map Pin as the Primary Anchor: Intuitive, distinguishable pins serve as the critical gateway for users to orient location and access market details.
Directions & Multi-Modal Transit are Table Stakes: Quick navigation via one-click directions and flexible transit options is essential for immediate trip planning.
Leveraging Jakob’s Law: Mirroring established mental models (like Google Maps) eliminated onboarding friction, enabling instant familiarity and effortless navigation.
Links and Reference
User research report on Google Drive
Prototype on Figma
User Research & Usability Testing Plan on Notion
Usability Testing Report on Google Drive
Competitor Analysis on Google Drive